Which Leading Indicators Best Predict Major Market Declines
We’re currently in a major market decline. Nevertheless, I find it helpful to regularly look at leading indicators to determine the market sentiment and plan the next steps of my portfolio.
Generally, one indicator, metric, or number never helps anyone determine what’s happening in the market. Context is always much more important than any one metric. There is an excellent visualization with Lego bricks that visualizes that data in and for itself has no real meaning. Only when we start viewing it in the proper context can we create a useful story that would help us predict the future.

When determining the market sentiment, trying to predict a market downturn, or valuing companies, data or, in our case, metrics like PE, RoE, ROIC, PS, PFC, and all the other metrics have to be looked at in the proper context.
For different companies, the context can vary enormously. Valuing companies like Cisco (CSCO) is very different than valuing Crowdstrike (CRWD).
What leading indicators exist to determine market downturns?
In this analysis and summary, we’ll look at the following indicators:
The Buffet Indicator
It is determined by calculating the Market capitalization-to-GDP ratio. Warren Buffett proposed it in 2001, using the US Wilshire 5000 index to US GDP to calculate the ratio.
Tobin’s Q
It is determined by dividing the market value by the equity book value. It is a ratio that relates companies’ real assets with their financial valuation. It was invented in 1966, before the emergence of asset-light software companies.
S&P 500 P/E Ratio
Instead of calculating a single company's Price to Earning ratio, this ratio determines it for the whole S&P 500 group. It’s an often-used benchmark to assess market sentiment.
S&P 500 CAPE Ratio
Robert Shiller developed this metric. It considers the cyclicality of companies’ earnings and helps to smooth this out to provide a more accurate representation between current prices and earnings. It takes the average of the last ten years of earnings, adjusts them for inflation, and divides the current index prices by that adjusted earnings.
10-2 Year Yield Spread
We’re currently reading a lot about the inversion of the treasury curve. The inversion happens when a longer-term treasury holding trades at a lower yield than a shorter-term one. The 10-2 year Yield Spread subtracts the 2-year treasury bond yield from the 10-year treasury bond yield. An inversion is an unusual phenomenon. It is often followed or accompanied by a recession. But recessions can happen without an inversion occurring.
10-year - 3 months Yield Spread
Same story as the one above, just for a much shorter maturity bond yield.
S&P 500 YoY Earnings Growth
It looks at the earnings growth of the aggregate S&P 500 on a YoY basis. This is seldom a good predictor of a recession, as an earnings growth downturn most frequently occurs when the economy is already in a recession.
The article by Y-Charts provides an excellent summary table of their key findings regarding the prediction potential of each of these leading indicators.

Y-Charts set two timeframes. One from 1950-1970 until now and the other starting in 2000. The reason is that after the year 2000, the emergence of asset-light software companies slowly took over the majority of the stock market, which led to higher valuations in relation to real assets.
That is a big difference from the previous five decades when asset-heavy industries were at the stock market's top. Some of these were companies like GM, Emerson, Kodak, General Electric, and others that are now valued much less than famous software companies like Microsoft, Google, or Netflix.
The table above shows the number of declines in the timeframes and the percentage of significant declines preceded by an overvaluation signal in the leading indicators we’re examining.
The fifth column shows the late signal, and logically we see the S&P 500 YoY earnings growth is leading in this segment. When we think about it, it makes sense. In a recession and preceding it, the earnings potential has a high chance of decreasing. At the top of the recession, we should logically reach the lowest earnings growth.
The last column shows the months in which the leading indicators preceded the subsequent recession.
A look at each Leading Indicator
A closer look at each leading indicator allows us to determine its prediction potential for future recessions.
Each indicator is plotted against the S&P 500 1-year, 3-year, and 5-year forward return.
The Buffett Indicator
The Buffet Indicator tends to tilt to the fourth quadrant, which makes sense as an undervaluation or lower number indicator for higher forward returns.

Buffet Indicator plotted against the 1-Year, 3-Year, and 5-Year Forward Return
Quadrants 1 and 3 points to less accurate prediction of subsequent return, while Quadrants 2 and 4 would mean that the indicator has been accurate. Most of the forward return data points fall into quadrant 4, meaning that the indicator says the market is undervalued and its forward return is positive.
There are still a lot of points in Q1 and 3, which sometimes makes the indicator a bit fuzzy.
Out of 14 market declines, the indicator gave advance warnings to 7. The indicator has been overvalued since Q3 2016.
Since 2000 the average of the Buffet indicator has been around 110%, with a 20% margin on top. That’s a 132% overvaluation threshold. With the updated threshold, out of 7 market declines, this one provided a warning for four of them.
This indicator provided more well-time warnings than all other indicators.
The indicator didn’t work out well in 2007-2009, 2015-16, and early 2018
Shiller’s CAPE Ratio
The Shiller CAPE ratio can be fuzzy at times. The PE ratio of the stock market changed drastically over the years. The stock market adds a unique premium on those asset-light software companies that have the potential to proliferate.
Also, since 2000 the US market has experienced higher financialization, which adds to the higher PE ratios.

Shiller CAPE Ratio plotted against the 1-Year, 3-Year, and 5-Year Forward Return
Between 1950 and 2000, the threshold for the CAPE ratio was set at around 25. Beginning in 2000, the threshold increased to ~33, which is considered with the dashed red line.
When we use it as an indicator with its average, it signaled overvaluation between 2002 and 2006 until the GFC and from 2017 to 2020 or so. Without some combination with other indicators, its predictive accuracy is fuzzy, especially considering that at times when it predicted overvaluation correctly, the time until the market peak could be between 8-51 months.
Tobin’s Q
This indicator hasn’t been good over the last 20 years. Before the 2000s, the indicators haven’t given any warning signal. And after 2000, one warning persisted through more than one significant decline.
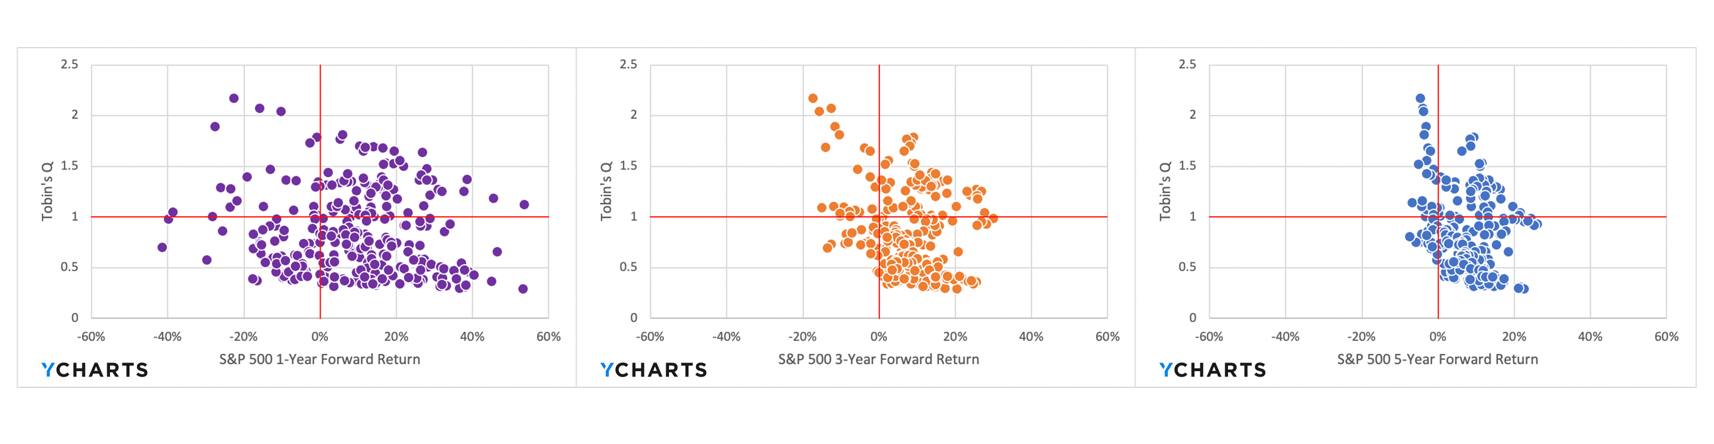
Tobin’s Q plotted against the 1-Year, 3-Year, and 5-Year Forward Return
As with all the other indicators, using this one by itself is not useful. It showed the market peak in 2002 but has been above its average for quite some time. AIt also showed overvaluation between 1997 and 2001. Important to note that many of the companies within the S&P 500 were not capital-light businesses that focus on software like Microsoft or Google. These companies will skew this indicator in newer times.
Since 2000, this indicator has provided warnings correctly for 3/7.
Negative Yield Spreads
Negative yield spreads signify a flattening or inverting of the yield curve. Inversions and flattenings are seen as warnings of a recession and typically accompany market declines.
Two of the most widely used spreads at the 10y-3month yield spread and the 10-2year yield spread.

Negative Yield Spreads plotted against the 1-Year, 3-Year, and 5-Year Forward Return
Opposed to wide-held belief, this indicator's correlation with the forward return of the S&P 500 landed most often in Quadrant 4 than in 3. That means there were more positive forward return instances when the spread was negative than the opposite.
The indicators provided warnings in 8/16 major market declines since 1962. I think this one depends on the financial situation of the US and then the stock market. Generally, the market can fall into a recession without an inversion of the curve. So when the curve inverts, the chance is high that there is a recession. But when the market declines, the curve must not invert.
How well does the spread correlate to forward S&P 500 returns?
Most instances fell into quadrant 4, where the indicator signals a recession while the forward S&P 500 return was positive.
The indicator has often oscillated between the zero line for periods of time, which provided too much warning about market declines.
S&P 500 P/E Ratio
This indicator provides a more sector-relevant comparison method. It makes sense to compare a company with peers and, more importantly, with its industry or sector.

S&P 500 P/E Ratio plotted against the 1-Year, 3-Year, and 5-Year Forward Return
The PE forward return correlation work well. Lower PE ratios correlate well with positive forward returns. That’s when the S&P 500 stocks were “cheap.”
Then there are four outliers - the GFC, where the S&P PE was at 60. that correlated well with negative returns.
As for the predictive power, the indicator provided advance warning in 4/10 cases. But the accuracy and timing of the warning signals post-2000 made it difficult to rely on them for decision-making.
Its prediction accuracy is not very good. After the 2000s, it could only tell two out of 7 major market declines where it passed the threshold of 31. It was also late in noticing the decline of 2000-2002.
Conclusion
No single valuation indicator has a perfect track record predicting significant market declines. Each indicator only loosely correlated to forward S&P 500 returns, which indicates that none of them were sufficient to serve as a basis for regular decision-making.
Yet, some indicators, like the Buffet Indicator, yield spread inversion, and the CAPE Ratio, provided the most consistency and accuracy in predicting major declines. Using multiple indicators could help identify overvaluation and potential declines.
After the 2000s, higher thresholds help to improve the timing accuracy somewhat. The reason could be the higher financialization of the markets and the capital-light approach of the companies.
When looking at the indicators after 2000, the Buffet Indicator and CAPE ratio were the most reliable indicators. The inversion yield spread before 2000 could also be a good indicator.
Thank you for reading my summary and thoughts about leading indicators. You can access the full report here.