The Superiority of Small Value Stocks
My inspiration for this article came from French and Fama’s famous Migration Paper, which discusses how stocks of different sizes (above median NYSE market cap) and types (value, growth stocks defined by Price-to-Book ratio) migrate between types and size and their resulting excess returns they generate during migration.
This paper studies how the migration of stocks across size and value portfolios contributes to the size and value premiums across stock returns. The results from Fama and French’s research are impactful for investors. Based on nearly 100 years of stock returns, Fama and French found out that small stocks (defined by their market capitalization, below the indices list of stocks' median stock market cap) outperform big stocks (market cap above the median market cap of the stocks within the index). They also found out that value stocks (defined by lower Price-to-Book ratios) outperform growth stocks while at the same time being less risky than their counterparts.
Let’s dive into the research.
Smaller stocks often have the most extreme positive effects on excess market returns can transition in type (from value to neutral to growth) or size (small stocks become big stocks) - this is the value premium.
The paper discusses two sources of excess returns: the value premium and the size premium. The size premium is entirely due to small stocks that earn extreme positive results and become big stocks. The value premium is a phenomenon in which stocks with low ratios of price-to-book value (value stocks) have higher average returns than stocks with high price-to-book ratios (growth stocks). This premium is also known as the "value effect," and it is the phenomenon where value stocks have higher returns than growth stocks. The value premium results from three areas:
Value stocks that are either acquired to earn high returns, so they become large stocks.
Growth stocks that earn average results and move towards neutral or value stocks
Value stocks that have slightly higher returns and remain in the same portfolio compared to growth stocks that do not move.
The paper stipulates that the size premium relates directly to smaller stocks with low market capitalization and that those will have higher average returns than big stocks.
Fama and French (2005) found that the price-to-book ratio is a key variable to determine the average return of growth stocks (high multiples, high profitability, usually high PB ratio) that usually move downward and value stocks (low multiples, mediocre profitability, low PB ratio) move upward towards growth area.
As the industry or companies experience high profitability, it creates competition which erodes the high profitability of growth stocks, and with it their profitability. Each year, some growth stocks decline in value that were rewarded by the market with low discount rates (expected stock returns).
Value portfolios with low PB ratios tend to rise in the years after formation. As these companies restructure, their profitability improves, and they are rewarded by the market with lower discount rates.
The paper splits the portfolios into four migration groups:
Same - stocks that stay in the same portfolios that are rebalanced at the end of June of the following year
dSize - small stocks that become big and big stocks that become small
Plus - stocks that improve in type, they move towards growth, or are acquired by another firm.
Minus - stocks that deteriorate, move toward value, are delisted as their book equity goes negative.
That important information is that excess returns (positive and negative) that each migration group contributes to the return of the portfolios.
Migration Group’s Contribution to a Portfolio’s excess returns
We split the migration group into two parts: Size Premium and Value Premium.
Size Premium: Smaller stocks generate higher average returns primarily from migrating from small stocks to big stocks. This happens when a stock that traded below the median of all stocks within the NYSE trades above the media in the following year. The median market capitalization of companies listed on the S&P500 is around $8bn.
The reverse is also true and contributes to strong negative average excess returns when a big stock becomes small. This migration contributes only little to the size premium because the market cap of big stocks that become small is very small compared to the total market capitalization of the big stock portfolio.
The migration from small to big stock generates a size premium that averages ~60% from 1927-2006 (more than 50% contribution) earned only by the 8-12% of small stock market caps.
Value Premium: The value premium consists of stocks with low price-to-book ratios (value stocks) and generally generate a higher return than stocks with high price-to-book ratios (growth stocks). Stocks that stay in the same group (1. Same) contribute little to the value premium for small and big stocks. Stocks that migrate in type (plus, minus) drive the contribution to value premiums.
Plus migrations generate high returns and contribute about 3.5% MORE YoY to excess returns than a matching growth portfolio. Minus transitions contribute negatively to excess returns.
Between small value and small growth stocks there is a particularly large spread - from 1926-2006, minus transitions contributed 5.1% YoY for small stock value premiums and only 1.2% for big stocks.
Small growth stocks have a higher chance (11.8%) to move to a big stock than small value stocks (8.5%). The small to big transition add 2.9% YoY to the average return of the small growth portfolio and lean against the value premium, which showed a more positive development for value stocks.
Transition Frequencies
Transition frequencies capture the movements of the stocks from small to big stocks or from one group like value towards neutral and finally growth. The table below reports two things: The percentage of the market cap of a portfolio, and the number of stocks within the portfolio.

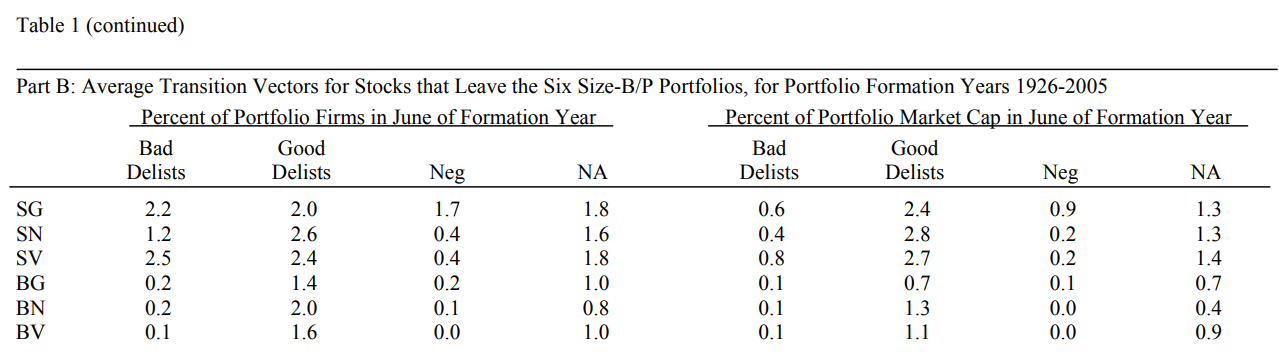
Table containing the percentage of portfolio stocks that migrate in size of in type.
Big growth stocks are the most likely to remain in the same group. For big neutral and big value the stocks that remain in the same portfolio are a bit lower at 69% and 75% respectively. It’s also important to consider that jumps from big value to big growth are rarer than jumps from big value to big neutral.
Size transitions, meaning stocks that move from small to big, are rarer than movements between the types across the P/B boundary, like value stocks that become growth stocks.
In the small portfolios, value stocks rarely make the jump directly toward growth within one year. Most of the jumps go from value towards neutral or neutral towards growth. Large transitions within the big stock portfolios are even rarer.
More transitions occur from big to small stocks than the other way around in terms of market cap. The reason is that the stocks in the big portfolios are mostly at the lower boundary and contribute only to a small part of the portfolio.
These movements have important implications for the returns they generate for investors. The returns generated by small stocks migrating upwards are extreme. Stocks in the small stock growth portfolio are on average more likely to become big stocks than those in neutral and value portfolios. The reason is that growth stocks have on average larger market capitalization than distressed value and neutral stocks.
Stocks that transition from small to big generally remain in the same type category.
Transition out of the Six-Size P/B Portfolio
There are good and bad delists. Good delists are occasions where companies go private by acquisition or similar. Small value stocks are more often acquired and receive good delists than small growth. The chance for bad delists - like bankruptcies - is higher for small growth stocks.
One conclusion is that a larger share of companies in the small growth portfolios are distressed companies that have been misclassified with high PB-ratios because their book value has fallen more than their market value.
Migration Returns
The excess returns above market return are shown in the following table. It’s noteworthy that the size and value effects are apparent in the returns of the six portfolios.

Average annual percent returns in excess of the market return for migration outcomes in the year after portfolio formation.
The small value portfolio generated an excess return of 9.2% and the big value portfolio 4.8%. The small growth portfolio generated an excess return of 2.2% and the big growth portfolio -0.9%.
The small portfolios returns exceeded those of the big portfolios. Within this context, migration from type to type or small to big were the main contributors to the excess returns.
Migration from small to big generated returns ranging from 34.3% to 165.8% per year. From big to small migration returns ranged from -24.1% to -53.2% but the contributions to the overall return of those portfolios were rather small compared to the returns from small to big migrations.
Migration between the groups SG, SN, and SV generated on average 18.8% to 50.3% excess returns between the small portfolios and 16.5% to 29.7% for the big portfolios.
Group Average Returns
Generally, the migration types result in returns that mirror their categorization. Plus transitions almost always generate more than 10% above the portfolio’s average excess returns. Small to big stock migrations have the highest average excess return, these are dSize returns, from 50.1% to 61.6% per year.
The following table shows surprising results like stocks that remain in the same portfolio generate returns that are on average lower than the portfolio’s excess return.


Migration: Average annual excess returns, average transition vectors, and average contributions to average excess returns
Stocks in the big growth portfolios have the highest chance of minus transitions with 10.9% of the stocks experiencing minus transitions.
Staying in the same portfolio year-over-year is worse news for small than for big stocks. Around 10% of small stock market cap migrates to a big portfolio, which is highly positive for excess returns.
In the small stock portfolios, staying in the growth portfolio is worse than staying in the value portfolio.
Group Contribution to Portfolio Average Return
For the size premium (higher average returns of small stocks relative to big stocks) minus transitions reduce the average returns more for small portfolios than for big stock portfolios. The size premium in big portfolios in average returns lean against minus and same group excess returns.
For plus transitions, the return contributions for small stocks are equal to or a bit higher than for big stocks.
The dominant source of excess return is the migration from small stocks to big stocks. It’s important to put this into context. Small value stocks more often change their type as they’re moving up the ladder towards neutral and then growth. This is often a multi-year trend that is not captured in this research.
Between 1927-2006, small stocks market cap that migrates makes up 8.5% (SV), 10.2% (SN), and 11.8% (SG). The excess returns from these migrations are 61.5% (SV), 50.1% (SN), and 61.6% (SG) per year. This results in average portfolio excess returns in small portfolios that become big of 5.6% (SV), 5.1% (SN), and 8.5% (SG) YoY.
In regard to the value premium (stocks with low PB ratios) minus transitions add a substantial 5.1% from 1927-2006 spread between small value and small growth returns and 1.2% between big growth and value. That means that growth stocks are in general more inclined to minus transition which negatively affects their performance. Plus transitions contribute 3.7% value spread for small stocks and 3.2% for big stocks.
Minus transitions are a big drag. Minus transitions are more common for growth stocks and rare for value stocks as these are already distressed. 25.8% of the market cap of small growth potfolio and 10.9% of big growth portfolios fall into the minus category. Only 1% for SV and 0.1% for BV. The story is symmetrical for plus transitions, which is more common for value stocks.
Conclusion
The study concludes that the size premium, or the higher average returns of small stocks compared to big stocks, is primarily due to small stocks moving to big stock portfolios, which leads to extremely positive returns. The value premium, or the higher average returns of value stocks compared to growth stocks, is due to a combination of factors.
Value stocks are more likely to experience positive returns from improving their type (moving from value to growth for example).
Growth stocks are more likely to experience negative returns from deteriorating their type.
Value stocks that stay in the same portfolio from one year to the next tend to have higher average returns than growth stocks that stay in the same portfolio.
These findings suggest that investors should pay attention to the potential for small stocks to move to big stock portfolios and for value stocks to improve their type when making portfolio allocation decisions.
The chances to pick bad growth stocks is much higher than picking small value stocks that can experience much more value premium than their peers.
In general, investors can enjoy the best returns when relying on self-balancing index funds that would focus on smaller stocks that fall into the value category. When thinking about portfolio allocation, it’s essential to diversify further and think about the individual’s risk tolerance. Adding big stock index funds allows for stability and diversifying with other index funds like emerging markets, and international. The goal is to create a comprehensible risk-balanced portfolio that is able to statistically outperform the S&P 500 over a timeframe of 25-30 years.